.png)
A payment either works or it does not. That is the entire experience from the outside. What the invoice shows you is a single number, and what the customer sees is a confirmation screen. Neither reveals the four or five separate parties that took a cut on the way through.
Every card transaction passes through five distinct fee layers. The pricing model your provider uses does not change which layers exist. It only changes which of them you see itemized [1].
The layers at the top of that table are set by the card networks and move for nobody. The layer at the bottom is the one that determines whether a cross-border transaction costs roughly what a domestic one does, or several times more.
Interchange is the fee the acquiring bank pays to the cardholder's issuing bank on every card transaction. It is set by Visa and Mastercard through published rate tables, and no party in the payment chain can alter it [2]. It is typically the largest single component of a domestic transaction.
The rate varies by card type, transaction method, and geography. In the EU, consumer card interchange is capped at 0.2% for debit and 0.3% for credit under the Interchange Fee Regulation [3]. In the US, interchange is uncapped and typically runs from 1.0-2.5% depending on the card product. A UK consumer debit card carries roughly 0.2%. A US business rewards card can carry 2.5% [4].
This matters for a reason that has nothing to do with pricing conversations. Interchange is why the same product, sold at the same price, costs a merchant a different amount depending on which card the customer happened to reach for. It is the clearest demonstration that payment cost is a property of the transaction, not of the provider.
What does move interchange is the data attached to the transaction. Sending Level 2 and Level 3 data on B2B payments can qualify a transaction for a lower interchange category. 3D Secure authentication qualifies transactions as lower risk. Prompt settlement avoids downgrade surcharges [2]. These are transaction-level engineering decisions rather than commercial ones, and they are available to any merchant regardless of who processes their payments.
On domestic transactions, this layer does not exist at all. On cross-border transactions it is frequently the largest one, and it is the only layer that never appears as a line item.
When a customer pays in one currency and the merchant settles in another, a conversion happens somewhere in the chain. The difference between the mid-market reference rate and the rate applied at conversion is the FX spread. It is embedded in the exchange rate rather than charged as a fee, which is why it stays invisible on an invoice even when it is the largest cost in the transaction [4].
The size of that spread is a function of the corridor, not of anyone's generosity. Major pairs like USD/EUR and USD/GBP are deep, heavily traded, and tightly priced. Emerging market pairs are thinner, involve fewer counterparties willing to hold the currency, and price accordingly. Converting into a freely floating, deeply traded currency and converting into a managed, thinly traded one are not the same operation and do not cost the same.
The number of parties touching the money matters as much as the currency pair. A payment that crosses three correspondent banks is priced more than once on the way through. The stablecoin sandwich settlement model exists largely because collapsing that chain removes the intermediate steps that each carry a spread.
Every layer in the stack gets more expensive when the transaction crosses a border, and the layers compound.
When the customer's issuing bank sits in a different country from the acquiring bank, the card networks apply higher interchange rates and add cross-border scheme fees. The acquirer carries additional cost for the same transaction. And the FX spread, which was zero domestically, now applies [2].
A transaction that costs roughly 2% domestically can cost several times that cross-border once every layer is accounted for [4]. This is not a pricing failure or a provider being opportunistic. It is what the transaction actually costs to move through the infrastructure it has been routed through.
Which points at where the real lever sits.
The most consequential variable in cross-border payment cost is not what any individual layer is priced at. It is whether the transaction is processed as a domestic transaction or a foreign one in the first place.
Local acquiring means processing through an acquiring entity in the customer's own country. The issuing bank then sees a domestic transaction rather than a foreign one. The cross-border interchange premium does not apply, because it is no longer a cross-border transaction. The cross-border scheme fees do not apply. And because settlement happens in local currency, FX conversion moves from the transaction layer to the settlement layer, where it can be handled once in aggregate rather than repeatedly on every individual payment.
The revenue effect is larger than the cost effect, and it is the part most businesses miss. Issuing banks apply stricter fraud scoring to foreign transactions, so cross-border authorization rates run materially below domestic ones. Data across providers shows local acquiring improving cross-border approval rates by 16-20% [6]. On meaningful volume, transactions that were previously being declined and are now approved outweigh any individual fee line by a wide margin.
This is why the cost conversation and the conversion conversation are the same conversation, and why treating payment cost purely as a procurement exercise misses where most of the money actually is.
Both pricing models contain all five layers. The difference is visibility, not total.
Flat-rate pricing bundles everything into a single percentage plus a fixed per-transaction fee. It is predictable and simple to forecast, which for many businesses is worth more than granularity. The trade-off is that a low-interchange EU debit card and a high-interchange US rewards card are billed identically, so the blended rate is doing the work of smoothing the difference.
Interchange-plus pricing separates pass-through interchange from the provider's margin. Each transaction is billed at its actual interchange plus a defined margin. It is less predictable month to month, because the card mix moves, but it makes the underlying structure visible [5].
Neither model is universally better. Flat-rate suits businesses that value forecastability and have a stable card mix. Interchange-plus suits businesses whose card mix skews toward lower-interchange products, where a blended rate would be working against them. The right answer depends on the shape of the transaction base, not on which model is cheaper in the abstract.
For businesses thinking about how a gateway fits a cross-border operation more broadly, including acceptance breadth, authorization performance, and payout capability, our international payment gateway guide covers the wider evaluation.
[1] Payrails. "Payment Processing Fees: Fixed, Interchange Plus, Interchange++." June 2026. https://www.payrails.com/blog/payment-processing-fees-interchange-plus-vs-flat-rate
[2] Adyen. "Interchange Fees Explained." April 2026. https://www.adyen.com/knowledge-hub/interchange-fees-explained
[3] Interchange Fees EU. "What Are Interchange Fees? Complete EU Guide 2026." March 2026. https://interchangefeeseu.com/blog/what-are-interchange-fees-complete-guide-2026
[4] Airwallex. "Payment Gateway Fees Explained: Costs, Comparisons, and How to Reduce Them." February 2026. https://www.airwallex.com/uk/blog/payment-gateway-fees-explained-costs-comparisons-and-how-to-reduce-them
[5] Shuttle. "How Much Does a Payment Gateway Cost? Fees, Pricing & Hidden Costs." March 2026. https://www.shuttleglobal.com/guides/payment-gateway-cost/
[6] Solidgate. "Authorization Rate Optimization: The 2026 Playbook." April 2026. https://solidgate.com/blog/authorization-rate-optimization/

Thailand's shift to digital payments is the most complete in Southeast Asia. Account-to-account (A2A) payments captured 44% of e-commerce transaction value and 43% of point-of-sale value in 2025, the highest A2A share of any market in the region [1]. Cards remain relevant for higher-value purchases and international transactions, but PromptPay has become the default payment method for the majority of Thai consumers.
Thailand's mobile payments market is estimated at $34.08 billion in 2026, growing from $29.73 billion in 2025 at a CAGR of 14.62% through 2031 [2]. Three digital bank licenses were granted in April 2025 (Krungthai-AIS-Gulf-OR, SCBX-KakaoBank-WeBank, and Ascend Money-Ant International), adding competitive pressure that will deepen wallet adoption further [2].
PromptPay is Thailand's national QR-based payment system, overseen by the Bank of Thailand and operated through National ITMX. It allows users to send money instantly using mobile numbers, national ID numbers, or merchant QR codes.
The numbers define its dominance: 74 million registered users and over 74 million transactions processed daily [1]. Person-to-person transfers are free, a deliberate policy by the Bank of Thailand to drive financial inclusion. Merchant acceptance is embedded into every domestic bank app, making PromptPay as ubiquitous as cash was a decade ago.
PromptPay transfers captured 41.10% of Thailand's mobile payments market share in 2025 [2]. The system's strength comes from its status as public infrastructure rather than a commercial product. Unlike private wallets that compete for users, PromptPay sits beneath every bank and wallet, creating a universal acceptance layer.
For international businesses, the practical consequence is that a checkout without PromptPay loses access to 44% of Thai e-commerce spending. Integrating PromptPay through a payment gateway with Thai coverage is the single highest-impact action for conversion in this market.
TrueMoney holds approximately 16.8% of Thailand's wallet market share and serves a fundamentally different population segment than PromptPay. With 39,000 agent outlets across Thailand, TrueMoney functions as a cash-in network that converts physical cash into digital payments for consumers who do not have bank accounts or prefer not to use online banking [2].
TrueMoney's mobile wallet CAGR is 16.2%, and it could expand the Thai mobile payments market by $13.4 billion between 2026 and 2031 as it penetrates cash-heavy provinces outside Bangkok [2]. For international businesses targeting the Thai mass market beyond urban Bangkok, TrueMoney adds reach into a consumer segment that PromptPay alone does not fully cover.
Beyond PromptPay and TrueMoney, three additional wallets hold meaningful positions.
Rabbit LINE Pay integrates with Bangkok's BTS Skytrain system and the LINE messaging app. It bundles transit payments with micro-insurance and retail offers. Its user base skews urban and commuter-centric.
ShopeePay is the payment arm of Shopee, Southeast Asia's largest e-commerce platform. For merchants already selling on Shopee Thailand, ShopeePay integration is native to the platform.
GrabPay ties into Grab's ride-hailing and food delivery ecosystem. Grab Thailand's S.M.A.R.T. roadmap (announced April 2025) deepens the integration between rides, food, parcels, and GrabPay payments [2].
None of these wallets individually approach PromptPay's transaction volume, but together they represent the convenience layer that Thai consumers use for daily spending within specific ecosystems.
Thailand is at the center of Southeast Asia's cross-border QR payment network. PromptPay is now connected to more partner systems than any other national payment rail in the region.
The live cross-border connections include Singapore's PayNow (operational since April 2021, the first bilateral IPS link in ASEAN), Malaysia's DuitNow, Indonesia's QRIS, and Vietnam's VietQR [3]. A Thai tourist in Singapore can pay using PromptPay at any PayNow-accepting merchant. A Singaporean visiting Bangkok can pay with PayNow at PromptPay merchants.
Thailand is also a founding member of Project Nexus, the BIS-led multilateral platform linking real-time payment systems across Indonesia, Malaysia, Singapore, Thailand, the Philippines, and India. Project Nexus incorporated in Singapore in March 2025 and is expected to go live in 2026 [4].
For international businesses with customers or supply chains across ASEAN, these cross-border QR connections mean that a single Thai PromptPay integration increasingly enables acceptance of inbound payments from neighbouring countries. For the broader picture of how e-wallets work across Southeast Asia, including country-by-country breakdowns, see our SEA payments guide.
Three priorities for accepting payments in Thailand.
First, integrate PromptPay. This is the single most important payment method in Thailand. Without it, your checkout is inaccessible to the majority of Thai consumers. A payment gateway with PromptPay integration through National ITMX is the standard approach for international merchants.
Second, maintain card acceptance for higher-value transactions. Cards still account for a meaningful share of Thai e-commerce, particularly for international purchases, travel bookings, and premium goods. PromptPay and cards together cover the vast majority of Thai spending.
Third, consider TrueMoney for mass-market reach. If your business targets consumers outside Bangkok or in lower-income segments, TrueMoney's agent network provides cash-in capability that extends your addressable market beyond banked populations.
For businesses also paying out to Thai beneficiaries, Thailand is well-served by local rail payouts through PromptPay, with same-day settlement at significantly lower cost than SWIFT.
[1] Digital in Asia. "How Do Digital Payments Work in Southeast Asia in 2026?" June 2026. https://digitalinasia.com/how-digital-payments-work-in-southeast-asia/
[2] Mordor Intelligence. "Thailand Mobile Payments Market Report." January 2026. https://www.mordorintelligence.com/industry-reports/thailand-mobile-payments-market
[3] Digital in Asia. "State of Digital Payments Across Asia: A 15-Market Tracker." May 2026. https://digitalinasia.com/asia-digital-payments-tracker/
[4] BIS Innovation Hub. "Project Nexus: Enabling Instant Cross-Border Payments." https://www.bis.org/about/bisih/topics/fmis/nexus.htm
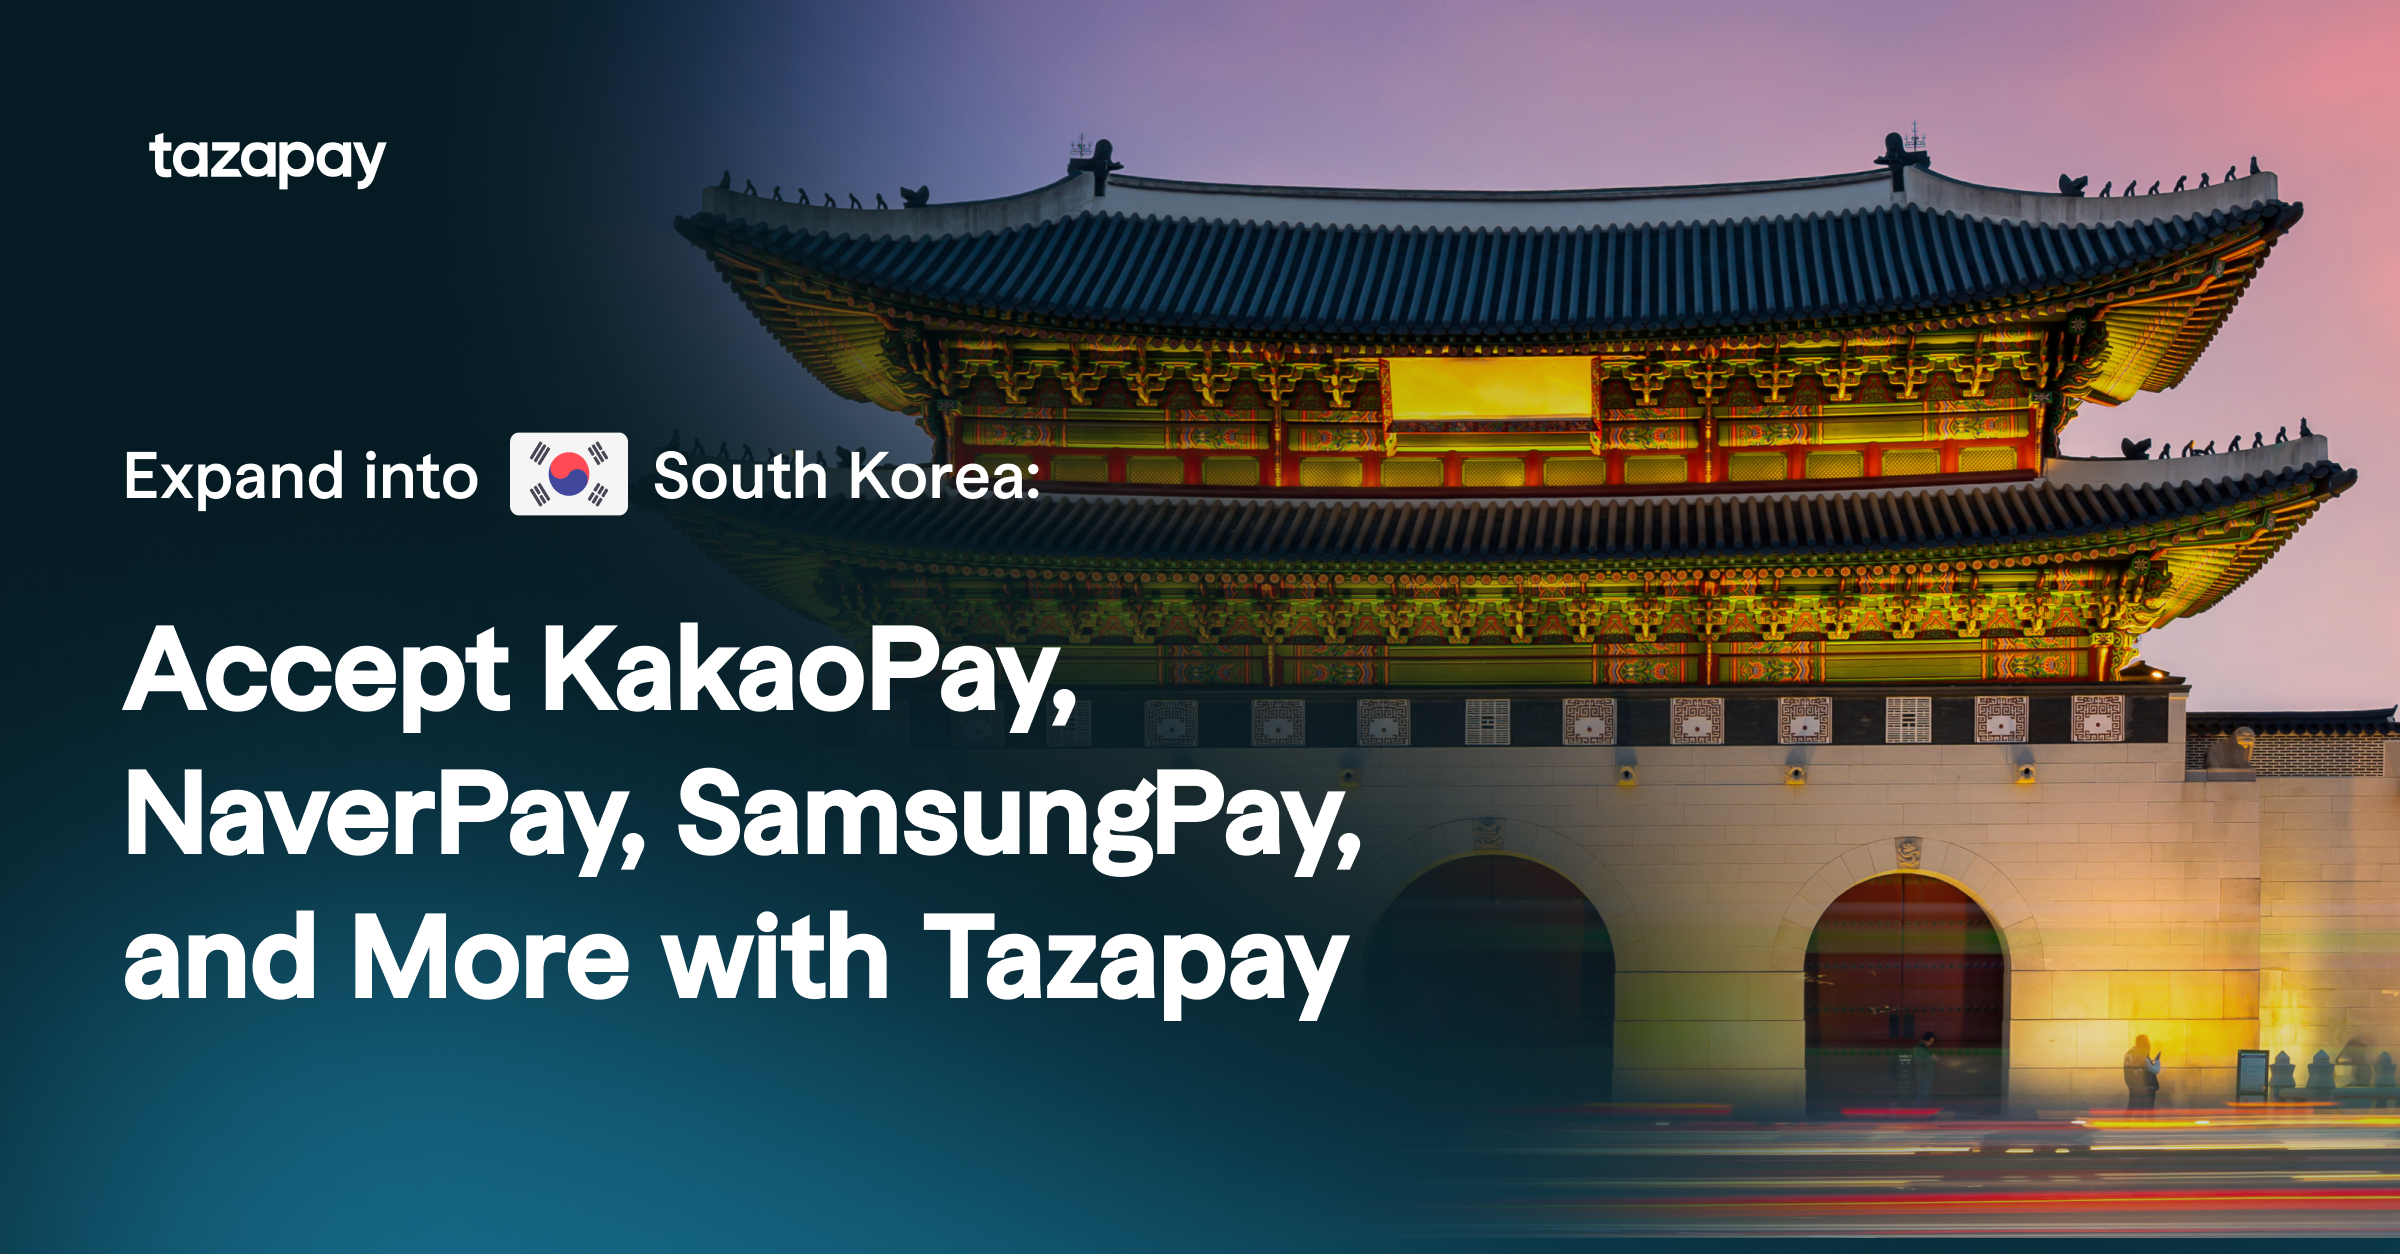
South Korea's mobile payments market is the most competitive in East Asia. Unlike China (where Alipay and WeChat Pay share a duopoly) or Japan (where PayPay dominates), Korea has three major wallets and strong card networks operating simultaneously [1].
The market reached $44.4 billion in 2025 and is forecast to grow to $48.3 billion in 2026, with daily wallet transactions hitting 29.71 million in the first half of 2024 [1]. Card networks (Visa, Mastercard, and Korean domestic card brands like Samsung Card and Shinhan Card) remain meaningful, particularly for higher-value transactions and international purchases. But for everyday spending, the wallet ecosystem is where Korean consumers live.
KakaoPay (Kakao Corporation) is the default payment app for most South Koreans because it is embedded within KakaoTalk, the messaging platform used by approximately 90% of the population. With over 36 million users, KakaoPay's integration into daily communication makes it the payment method with the lowest friction: users pay, transfer, and manage bills without leaving their primary messaging app [1].
KakaoPay covers money transfers, bill payments, online purchases, in-store QR payments, and insurance services. Its strength is the social layer: splitting bills, sending money to contacts, and paying merchants all happen within the same interface used for conversation.
For international businesses, KakaoPay is the single most important Korean wallet integration. Any checkout targeting Korean consumers without KakaoPay support is competing with one arm tied behind its back.
Toss (Viva Republica) is the most significant addition to the Korean payment landscape since our previous coverage. It started as a peer-to-peer transfer app and has expanded into a full financial super-app offering payments, banking, insurance, securities trading, and credit scoring.
Toss's user base skews younger than KakaoPay's and grows by offering a unified financial interface rather than embedding into a messaging app. For merchants targeting Korean consumers under 35, Toss integration is increasingly essential. Its bank (Toss Bank) and securities arm (Toss Securities) create a closed-loop ecosystem where users manage their entire financial life within a single app.
The competitive dynamic between Toss and KakaoPay is shaping Korean payments: KakaoPay wins on messaging integration and older demographics, while Toss wins on financial product depth and younger users. International businesses benefit from both, since the two platforms serve complementary segments.
Naver Pay is linked to Naver, South Korea's dominant search engine and the largest e-commerce platform through Naver Shopping. Users store payment credentials and pay with a single tap on Naver Shopping and partner merchants, reducing checkout friction and cart abandonment.
Naver Pay's strength is online commerce rather than in-store payments. For international businesses selling physical or digital goods to Korean consumers through e-commerce channels, Naver Pay integration directly impacts conversion rate on one of Korea's largest shopping platforms.
Samsung Pay holds a unique position because of its MST (Magnetic Secure Transmission) technology, which allows it to work at virtually any card terminal in Korea, not just NFC-enabled ones. This gives Samsung Pay broader physical acceptance than any QR-based wallet [1].
For in-store transactions, Samsung Pay captures consumers who prefer paying through their Samsung device at terminals that do not yet support QR codes or NFC. For online transactions, Samsung Pay functions similarly to other wallets.
The most significant development for Korean payments in 2025 was the KakaoPay-PayPay cross-border partnership, launched in September 2025. Japanese PayPay users can now make offline payments at over 2 million Korean merchants, and Korean tourists can use KakaoPay at PayPay's Japanese merchant network [1].
Additionally, Alipay+ extends PayPay's acceptance to 16 partner wallets across Asia, meaning GrabPay (SEA), GCash (Philippines), and Touch 'n Go (Malaysia) users can pay at PayPay merchants in Japan and, through the KakaoPay link, potentially at Korean merchants connected to the network [1].
For businesses operating across both Korea and Japan, this cross-border QR infrastructure reduces the need for separate integrations. For the equivalent breakdown of digital wallets across East Asia, including China, Japan, and Hong Kong, see our East Asia payments guide.
Three priorities for accepting payments in South Korea.
First, integrate KakaoPay as the primary wallet. Its reach across 90% of the Korean messaging population makes it the non-negotiable starting point. A payment gateway with KakaoPay integration through a Korean acquiring partner is the standard approach.
Second, add Toss for younger demographics. If your product or service targets Korean consumers under 35, Toss is increasingly the primary financial app for this segment. Naver Pay is essential if you sell through Naver Shopping or Naver-affiliated e-commerce channels.
Third, maintain card acceptance. Korean domestic card brands (Samsung, Shinhan, Hyundai, KB) plus Visa and Mastercard remain meaningful for higher-value transactions and B2B purchases. Cards and wallets together provide full coverage of Korean spending.
For businesses also paying out to Korean beneficiaries, South Korea is well-served by local rail disbursement.
[1] Digital in Asia. "State of Digital Payments Across Asia: A 15-Market Tracker." May 2026. https://digitalinasia.com/asia-digital-payments-tracker/
[2] Mordor Intelligence. "Asia-Pacific Payments Market Report." January 2026. https://www.mordorintelligence.com/industry-reports/asia-pacific-payments-market
[3] Fintech Singapore / Worldpay Global Payments Report 2026. "Southeast Asia Payment Methods in 2026." April 2026. https://fintechnews.sg/128337/e-commerce/southeast-asia-payment-methods-2026-global-payments-report/

East Asia's payment landscape is structurally distinct from both Western markets and Southeast Asia. In Western markets, Visa and Mastercard dominate. In Southeast Asia, government-built QR rails (QRIS, PromptPay, DuitNow) form the foundation. East Asia sits between these models: China and Japan were built by platform-first super-apps before any state-built alternative existed, while South Korea runs a competitive multi-wallet ecosystem alongside strong card networks [1].
The practical consequence for international businesses is that card acceptance alone is insufficient. Alipay and WeChat Pay account for 84% of Chinese online payments [2]. PayPay is the dominant Japanese QR wallet. KakaoPay, Toss, and Naver Pay collectively drive the majority of South Korean mobile transactions. Entering these markets without local payment method integration means losing the majority of potential customers at checkout.
For businesses also selling into Southeast Asian markets, where the ecosystem is equally wallet-driven but with different dominant players, see our SEA e-wallets guide.
China's digital payment ecosystem is the most mature in Asia. Two platforms dominate, and international card networks have negligible domestic penetration.
Alipay (Ant Group) has over 1.2 billion users globally, with the vast majority concentrated in mainland China [3]. It offers payments, transfers, wealth management, insurance, and credit. QR-code-based transactions are the standard for both online and offline purchases. In February 2026, Alipay launched AI Pay, which surpassed 100 million users within months and processed over 120 million transactions during Chinese New Year week alone, making it the first AI-native payment product at scale [1].
WeChat Pay is embedded within WeChat, the messaging app with over 1.3 billion monthly active users. Because payment is integrated into the same app used for social messaging, file sharing, and daily communication, it captures transactions that would otherwise bypass a standalone payment app. WeChat Pay's strength is its social commerce layer: peer-to-peer transfers, in-chat payments to merchants, and mini-program checkout all happen without leaving the conversation.
UnionPay remains China's dominant card network with cards accepted in over 180 countries. It accounts for 93% of overall card spending in China [4]. While wallets dominate in urban areas, UnionPay serves older demographics, rural regions, and higher-value transactions where card infrastructure is preferred.
For international businesses: Alipay and WeChat Pay are non-negotiable for selling to Chinese consumers. Integration through a compliant local partner or a payment gateway with China coverage is the only practical path. UnionPay matters for higher-value transactions and the demographic segments less reliant on mobile wallets.
Japan's mobile payments market is forecast at $0.28 trillion in 2025, growing at 31% CAGR to $1.07 trillion by 2030 [1]. The trajectory is steep, but Japan starts from a lower cashless base than its East Asian neighbours. The government's "cashless vision" targeted 40% non-cash share of household consumption by 2025, and progress has accelerated.
PayPay is the clear winner of Japan's QR wallet competition. With over 60 million users, it has become the default QR-based payment across convenience stores, restaurants, retail, and online checkout. PayPay's acquisition by the SoftBank-Yahoo Japan ecosystem gives it distribution advantages that competitors cannot replicate.
Rakuten Pay is the second major wallet, integrated into Rakuten's e-commerce platform and loyalty ecosystem. Users pay with linked credit cards or Rakuten Points, creating a closed-loop spending cycle. For merchants already on the Rakuten marketplace, Rakuten Pay integration is natural.
d Barai (NTT Docomo) leverages Japan's dominant mobile carrier to reach consumers who prefer telecom-linked payments. Its user base skews older and more suburban than PayPay's.
Cross-border QR interoperability is advancing rapidly. The KakaoPay-PayPay partnership launched in September 2025 allows Japanese PayPay users to make offline payments at over 2 million Korean merchants, and Korean tourists can use KakaoPay at PayPay's Japanese merchant network [1]. Alipay+ extends PayPay's acceptance to 16 partner wallets across Asia, meaning a Thai GrabPay user or a Filipino GCash user can pay at PayPay merchants in Japan [1]. Japan's METI has indicated full ASEAN cross-border QR interoperability is a 2026 target.
For international businesses: PayPay is the essential Japanese integration, with Rakuten Pay as the close second. Cards remain meaningful for higher-value transactions. Japan's cashless transition is genuine but slower than Korea or China, so a multi-rail strategy (PayPay + cards + Rakuten Pay) is necessary.
South Korea's mobile payments market reached $44.4 billion in 2025 and is forecast to grow to $48.3 billion in 2026 [1]. Daily wallet transactions hit 29.71 million in the first half of 2024. The market is structurally competitive, with three major wallets and strong card network presence.
KakaoPay (Kakao Corporation) integrates with KakaoTalk, the messaging app used by approximately 90% of South Koreans. With over 36 million users, KakaoPay covers money transfers, bill payments, online purchases, and in-store QR payments. Its integration into daily communication makes it a default payment method for a population that is already messaging-first.
Toss (Viva Republica) is the fastest-growing Korean fintech payment platform and was largely absent from older coverage of the Korean market. Toss has expanded from peer-to-peer transfers into a full financial super-app offering payments, banking, insurance, and investment. For merchants targeting younger Korean consumers, Toss integration is increasingly essential.
Naver Pay is linked to Naver, South Korea's dominant search engine and e-commerce platform. Users pay with stored credentials, reducing checkout friction on Naver Shopping and partner merchants. Its strength is in online commerce rather than in-store payments.
Samsung Pay leverages NFC and MST (Magnetic Secure Transmission) technology, allowing it to work at virtually any card terminal in Korea, not just NFC-enabled ones. This gives it broader physical acceptance than QR-based wallets.
For international businesses: Support KakaoPay as the primary wallet. Toss for younger demographics. Naver Pay for e-commerce. Cards (Visa, Mastercard, local Korean card networks) remain strong for higher-value transactions. For a deeper look at the South Korean payment landscape including detailed market share data, see our dedicated blog.
Hong Kong is the East Asian market where the correct strategy is to support everything. There is no single dominant wallet or rail. Cards, wallets, transit payments, and bank transfers all hold meaningful share simultaneously [1].
Octopus began as a transit card for Hong Kong's MTR and has expanded into retail, convenience stores, parking, and vending. Contactless tap payments via Octopus card or mobile app are deeply embedded in daily life. For small-value, high-frequency transactions, Octopus is the default.
AlipayHK is the localized version of Alipay for Hong Kong residents, with over 3 million users. It serves peer-to-peer transfers, bill payments, and online shopping in HKD. Critically, it also serves as the bridge for mainland Chinese tourists paying at Hong Kong merchants through Alipay's cross-border functionality.
WeChat Pay HK offers equivalent functionality for Hong Kong consumers within the WeChat ecosystem, plus cross-border payment access for mainland Chinese visitors.
Faster Payment System (FPS) is Hong Kong's real-time interbank transfer rail, operated by the HKMA. It enables instant transfers between banks using mobile numbers, email addresses, or FPS identifiers. FPS handles both HKD and RMB, supporting cross-border settlement with mainland China.
Cards remain significant. Visa and Mastercard have strong penetration, particularly for e-commerce and higher-value retail. Card payments account for approximately 38.6% of e-commerce transactions [4].
For international businesses: Hong Kong requires the broadest payment method coverage of any East Asian market. Octopus for transit and small-value, AlipayHK and WeChat Pay HK for tourists from mainland China, FPS for bank transfers, and Visa/Mastercard for higher-value retail and e-commerce. The operational complexity for merchants is real, but the alternative is losing significant customer segments.
The most significant development across East Asia in 2025-2026 is the linking of wallet ecosystems across borders.
The KakaoPay-PayPay partnership (September 2025) is the landmark deal: Japanese tourists pay in Korea via PayPay, Korean tourists pay in Japan via KakaoPay, all through existing QR infrastructure with no new app downloads [1]. Alipay+ extends this further by connecting PayPay to 16 partner wallets across Asia, including GrabPay, GCash, Touch 'n Go, and TrueMoney. This means a Southeast Asian tourist in Tokyo can pay at PayPay merchants using their home wallet.
Indonesia's QRIS is also pursuing interoperability with Japan and South Korea, while China has piloted cross-border QR linkages enabling millions of Indonesian merchants to accept Alipay and UnionPay [1].
For businesses operating across both East and Southeast Asia, these cross-border wallet connections are collapsing the distinction between "domestic" and "international" payment acceptance. A payment gateway that can accept cross-border QR payments alongside domestic methods will capture transaction volume that would otherwise require the customer to switch to an international card.
Three priorities for payment acceptance in East Asia.
First, integrate market-specific wallets. Alipay and WeChat Pay for China. PayPay for Japan. KakaoPay for South Korea. There is no single wallet that works across all four markets. Each requires its own integration, either directly or through a gateway with local coverage.
Second, maintain card acceptance alongside wallets. Unlike Southeast Asia where wallets have displaced cards, East Asian markets (particularly Japan, South Korea, and Hong Kong) maintain meaningful card transaction volume. Cards are not optional here, they are complementary.
Third, prepare for cross-border QR expansion. The KakaoPay-PayPay link and Alipay+ network mean that wallet-based cross-border payments are moving from pilot to production. Businesses with physical presence in Japan, Korea, or Hong Kong will see increasing inbound payments from tourists using their home-country wallets. Your payment infrastructure needs to accept these flows.
[1] Digital in Asia. "What is the State of Digital Payments Across Asia in 2026? A Comprehensive 15-Market Tracker." May 2026. https://digitalinasia.com/asia-digital-payments-tracker/
[2] GR4VY. "Payment Methods by Country 2026: What Dominates Each Market." April 2026. https://gr4vy.com/posts/payment-methods-by-country-2026-what-dominates-each-market-and-how-to-accept-them/
[3] Tazapay. "Local Payment Methods and E-Wallets in Southeast Asia: The 2026 Guide." https://tazapay.com/blog/local-payment-methods-ewallets-in-southeast-asia (cross-reference for Alipay user data)
[4] Primer.io. "A Guide to Alternative Payment Methods in Asia Pacific." March 2026. https://primer.io/blog/a-guide-to-alternative-payment-methods-in-asia-pacific
[5] Mordor Intelligence. "Asia-Pacific Payments Market Report." January 2026. https://www.mordorintelligence.com/industry-reports/asia-pacific-payments-market
[6] Fintech Singapore / Worldpay Global Payments Report 2026. "Southeast Asia Payment Methods in 2026." April 2026. https://fintechnews.sg/128337/e-commerce/southeast-asia-payment-methods-2026-global-payments-report/
Every international merchant has a decline rate they have quietly accepted as the cost of selling across borders. That acceptance is the problem. Domestic card transactions are approved 95 to 99 percent of the time. Cross-border transactions commonly fail 15 to 25 percent of the time [1]. That gap is not fraud, and it is not your customers' fault. It is a structural artifact of how the card networks score risk, and a large part of it is recoverable.
The mechanic is worth stating plainly because it points directly at the fix. When a card issued in one country is charged by a merchant whose acquirer sits in another country, the issuing bank sees a cross-border transaction. Cross-border transactions carry a higher statistical association with fraud, so the issuer applies stricter scoring and declines more aggressively, regardless of whether the specific transaction is fraudulent [1]. A perfectly good customer with a perfectly good card gets declined because the geography of the transaction looked risky to a model. The shopper rarely retries. The sale is gone.
For a business scaling internationally, this is revenue leakage disguised as a technical inevitability. The first step to fixing it is refusing to treat the decline rate as fixed.
Local acquiring removes the trigger. Instead of routing a customer's transaction through an acquirer in your home market, the transaction is processed through an acquiring entity in the customer's own region. To the issuer, the transaction now looks domestic, and domestic transactions clear the same fraud models that were declining the foreign version. Same card, same customer, same purchase, different routing, materially higher approval.
The size of the effect is well documented. Research on European flows shows local acquiring can raise approval rates by up to 21 percent compared with cross-border acquiring [1][2]. Beyond the approval lift, local acquiring often improves the economics in other ways: domestic interchange can be lower than cross-border interchange, settlement to the merchant can be faster, and the customer is more likely to see their preferred local payment experience. The approval-rate gain is the headline, but it travels with a cost and experience benefit.
The reason local acquiring deserves a place in the boardroom and not just the payments team is that the math is unusually clean. Authorization uplift is recovered revenue, not saved cost, and recovered revenue flows straight to the top line.
The standard worked example: on 200 million dollars of annual cross-border volume, a 2 to 4 percent improvement in authorization recovers 4 to 8 million dollars per year [3]. Scale that to your own volume and the figure is rarely trivial. Critically, this is revenue from customers who already wanted to buy and already had a valid card. There is no acquisition cost, no discount, no campaign. The sale was simply being declined by a risk model that local acquiring defuses. Few growth levers offer that profile.
To estimate your own opportunity, take your cross-border volume, identify the markets where your approval rate sits below your domestic baseline, and model the revenue at even a conservative uplift. The corridors where your declines are worst are usually the ones where local acquiring will move the needle most, which is also where you should pilot it first.
Local acquiring does not have to be all-or-nothing. The pragmatic path is to prioritize by pain.
Start by ranking your markets by two factors: cross-border volume and the gap between local and domestic approval rates. A market with high volume and a wide approval gap is your first candidate. Move acquiring for that market to a local entity, hold the rest constant, and measure the approval delta over a defined window against the prior baseline. The clean before-and-after is what proves the case internally and funds the next market. Then extend market by market, always measuring, so each expansion is justified by evidence rather than a vendor promise.
Two cautions keep the rollout honest. First, insist on corridor-level approval data from any provider, not a global blended rate, because a blended number can hide exactly the markets where you are bleeding. Second, treat local acquiring as one part of a broader optimization that includes retry logic, network tokenization, and clean transaction data, since the issuer's decision also depends on the quality of the data it receives. Local acquiring is the largest single lever, but it works best inside a complete approach to local acquiring rather than as an isolated switch.
Acceptance optimization and payout are two sides of the same cross-border problem, and the teams that solve one usually need to solve the other. A business lifting its approval rates in Southeast Asia is frequently the same business paying suppliers or sellers in those markets, where settlement speed and cost are the mirror-image challenge. Consolidating acceptance and disbursement with a provider that does both means the approval data and the payout data sit on one ledger, and the corridor economics are visible end to end. For teams whose volume is concentrated in the region, the patterns in Southeast Asia corridors show how the acceptance and payout sides connect in practice. Where beneficiaries prefer digital dollars, payout in stablecoins through Tazapay Canada Corp. closes the loop on the disbursement leg.
[1] Checkout.com. "Cross-border vs local acquiring: How to optimize global payments." 2025. https://www.checkout.com/blog/cross-border-vs-local-acquiring
[2] Nuvei. "The 2026 Guide to Global Payment Acceptance and Local Acquiring." 2026. https://www.nuvei.com/posts/the-2026-guide-to-global-payment-acceptance-local-acquiring-approval-rates-cross-border-optimization
[3] Stripe. "Global acquiring 101: A guide to cross-border payments." 2025. https://stripe.com/resources/more/global-acquiring-101

Most finance teams can recite their processing rate to the basis point. Almost none can state their FX markup, and that is not a coincidence. The processing fee is itemized because it is competitive and quotable. The FX markup is buried inside the exchange rate because it is neither. When your gateway converts a customer's payment from their currency into your settlement currency, it applies a rate, and the gap between that rate and the true mid-market rate is pure margin that never appears as a fee on any statement.
The scale is easy to underestimate. A markup of one to three percent on the converted amount routinely exceeds the entire processing fee for a cross-border transaction. On a business moving tens of millions across borders, that is a seven-figure cost line that no one has ever benchmarked, because it does not look like a cost. It looks like the exchange rate.
This is not a problem with one provider. It is a structural transparency gap that regulators are still trying to close. The G20's cross-border payments roadmap lists disclosure of FX rates and conversion charges among its explicit transparency targets, and its own 2025 progress report concedes that improvement has been slow and uneven, with the end-2027 targets unlikely to be met on current trends [1]. Where rules do exist they are inconsistent: the UK mandates fuller FX markup disclosure, while other markets leave it voluntary, which means hidden spreads persist by default [2]. Until disclosure is mandatory everywhere, the work of finding the markup falls to you.
To benchmark a cost you have to know where it lives. In a cross-border card transaction the spread can be applied at more than one point, and providers differ on which one they use.
The first place is at authorization and settlement, when the acquirer or gateway converts the transaction amount into your settlement currency. This is the most common location and the hardest to see, because the converted figure simply appears in your settlement report as a number. The second place is at payout, when you disburse funds in a currency other than the one you hold, and a second conversion happens on the way out. A business that collects in one currency and pays suppliers in several can be charged a markup on the way in and again on the way out, which is why the FX exposure on the payout side deserves its own scrutiny rather than being lumped into a single rate.
The third place is dynamic currency conversion at checkout, where the customer is offered to pay in their home currency and the conversion margin is shared between parties in the chain. This one is visible to the customer but rarely analyzed by the merchant as a cost to the business relationship.
Benchmarking the markup is methodical, not difficult. The reference point is the mid-market rate, the midpoint between the buy and sell rates in the wholesale FX market, which is what services like a central bank reference or a neutral market feed publish. Everything is measured against that.
Start by exporting a sample of cross-border transactions for a single corridor over a defined period, with the original currency amount, the converted amount, and the timestamp. For each transaction, pull the mid-market rate at that timestamp and compute what the converted amount should have been. The difference, expressed as a percentage of the transaction, is your effective FX markup for that corridor. Repeat per corridor, because the markup is rarely uniform: high-volume corridors may be tighter and thin corridors much wider. Weight by volume to get a blended cost, but keep the per-corridor numbers, because that is where the negotiation lives.
Once you have the number, you have leverage. The benchmark conversation with a provider should be specific: here is the effective markup we measured on this corridor, here is the mid-market reference, show us how you price it. The strongest providers treat this as a normal request and quote the mid-market rate alongside a transparent margin. The weakest treat your settlement export as the only source of truth, which is exactly the opacity the G20 roadmap is trying to legislate away.
Three demands are reasonable to put in writing during any review of payment gateway pricing. First, the mid-market reference rate shown next to the rate actually applied, per transaction or at least per corridor. Second, a single transparent FX margin rather than a spread that moves without explanation. Third, the same transparency on the payout leg as on acceptance, so a second hidden conversion is not reintroduced when you disburse. If a provider cannot or will not meet these, the markup is almost certainly a profit center they would rather you not measure.
There is also a structural fix beyond negotiation. Settling part of the flow over stablecoin rails collapses the conversion economics, because the all-in cost of moving regulated digital dollars runs an estimated 0.1 to 0.5 percent against the 2 to 7 percent true cost of traditional cross-border transfers [3], and the World Bank's Q3 2025 data still puts the global average for cross-border transfers at 6.36 percent [4]. For corridors where the markup is widest, a stablecoin payout leg through Tazapay Canada Corp. can remove the spread you have been paying twice.
The point of benchmarking the markup once is to never not know it again. Make the effective FX markup a standing line in your payments reporting, refreshed each quarter, broken out by corridor. The first time you run it, the number will likely surprise the finance team, because a cost that has been invisible for years tends to be larger than anyone guessed. After that, it becomes a managed cost like any other, with a target, an owner, and a trend.
This is the discipline that separates teams who control their cross-border economics from teams who are controlled by them. The processing rate gets all the attention because it is visible. The FX markup deserves more, because it is usually larger and almost always unmeasured. For teams running a full provider review, this benchmark belongs alongside the broader work of evaluating an international payment gateway, where FX transparency is one of the six questions that actually separate providers.
[1] Financial Stability Board. "G20 Roadmap for Cross-border Payments: Consolidated progress report for 2025." October 2025. https://www.fsb.org/2025/10/g20-roadmap-for-cross-border-payments-consolidated-progress-report-for-2025/
[2] Wise. "G20 Roadmap for Enhancing Cross-border Payments, One Year On." 2025. https://wise.com/p/g20-report-2025
[3] EY. "Cost savings and speed drive stablecoin adoption." 2025. https://www.ey.com/en_us/insights/financial-services/cost-savings-and-speed-drive-stablecoin-adoption
[4] World Bank. "Remittance Prices Worldwide, Issue 54." September 2025. https://remittanceprices.worldbank.org/sites/default/files/2026-04/RPW_main_report_and_annex_Q325.pdf


